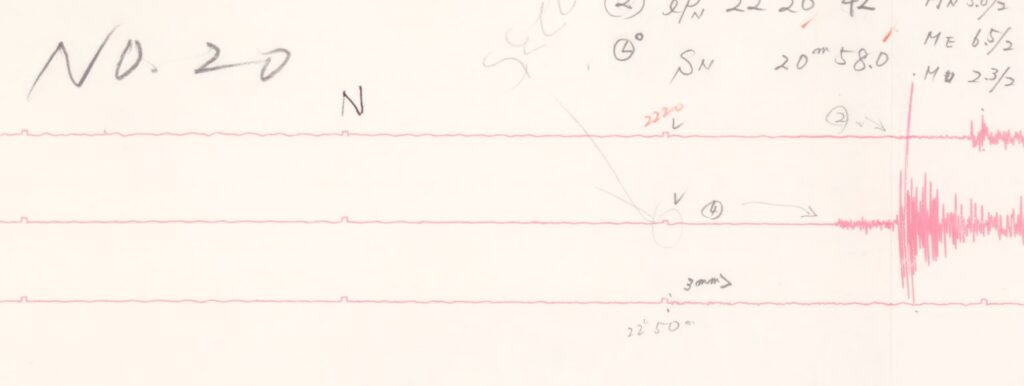
The published seismic record of the Swissair 111 crash was recorded 174km from the crash site at LMN Caledonia Mountain in New Brunswick, Canada. (45.8544° N, -64.8063° W) The crash was in 55m water depth the seismic deflection was approximately +/- 5mm with ambient noise around +/-0.5mm.
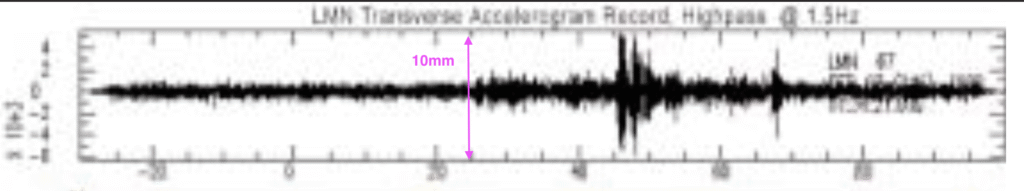
There is a clear first arrival at around 46 seconds then another at 48secs. There is what appears to be a shear wave arrival at around 68 seconds. The distance of impact from observatory can be determined from the dT between the Compressional and Shear arrival. D= dt / (1/Vs – 1/Vp). Vp is typically 6-8Km/s depending whether in surface sediment or deeper crust and Vs is typically 3.5-4.5Km/s.
A 1964 coastal study in the area showed Vp=6.1Km/s and Vs=3.68km/s. A more modern study showed Sedimentary cover/upper crust: Vp = 4.5–6.0 km/s. The empirical ‘rule of thumb’ is to use 8km/s per second of dT..i.e.(68-46)*8 = 22 x 8 = 176Km which closely matches the exact distance of 173.42Km of LMN observatory 45.8544° N, 64.8063° W and the impact at 44.409167N, -63.973611W
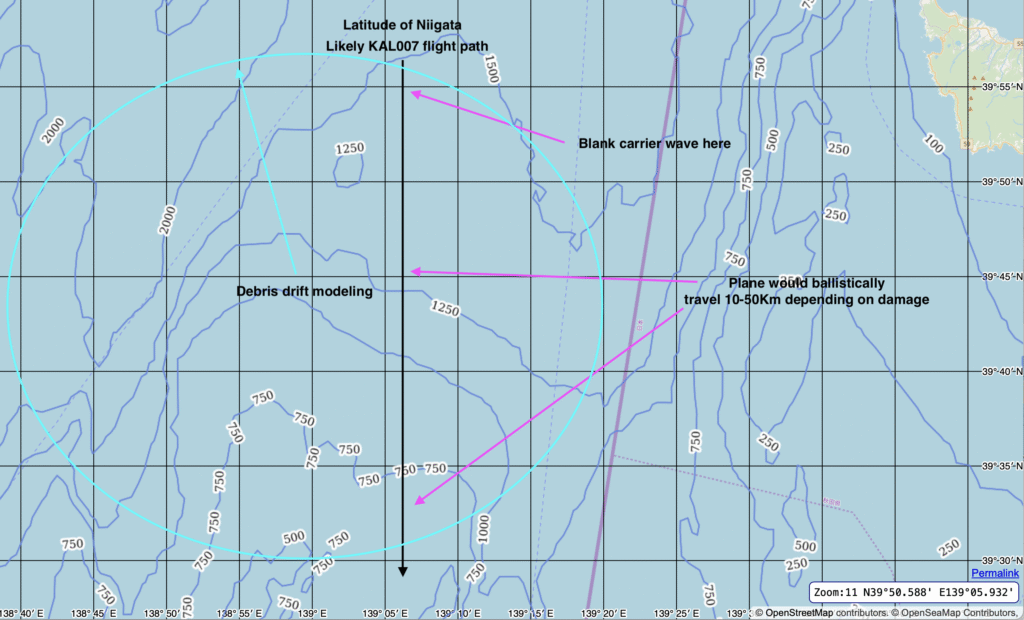
The water depth in the region defined by last radio contact and debris drift could be as shallow as 500m or as deep as 2000m.
Assuming a similar crash closer (100km vs 173km) but in much deeper water (approximately 1000m so much poorer coupling) the signal is expected to be much weaker. Amplitude would increase slightly with closer proximity but magnitude would drop with depth roughly 1/h. i.e. signal would be 55/1000 smaller = 0.055 that of LMN due to depth. So the expected amplitude deflection should be approximately 5 * 1.73 * 0.055 = +/- 0.5mm. However this estimation could vary easily by a factor of 3 or more in either direction with poorer/better coupling, a higher/lower energy impact or the impact occurring in deeper or shallower water. i.e. the depth of impact effects the estimation to about +/- 0.64mm in 750m water depth or +/-0.25mm in 2000m.
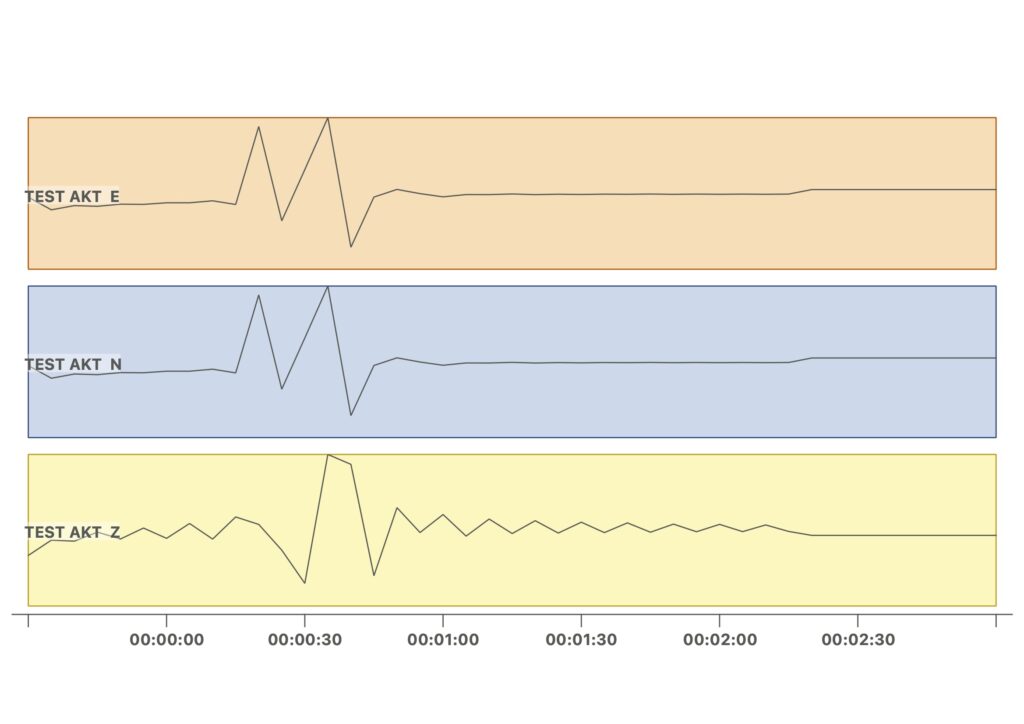
As can be seen from the above seismogram recorded at Akita for the May 26th, 1983 7.8 magnitude earthquake the ambient noise is much smaller than the small 1mm deflection of the timing marks…probably in order of +/- 0.1mm. Therefore a small deflection of 0.25-0.6mm for an event occurring in the early morning (low ambient noise) should still show on this same equipment a few months later.
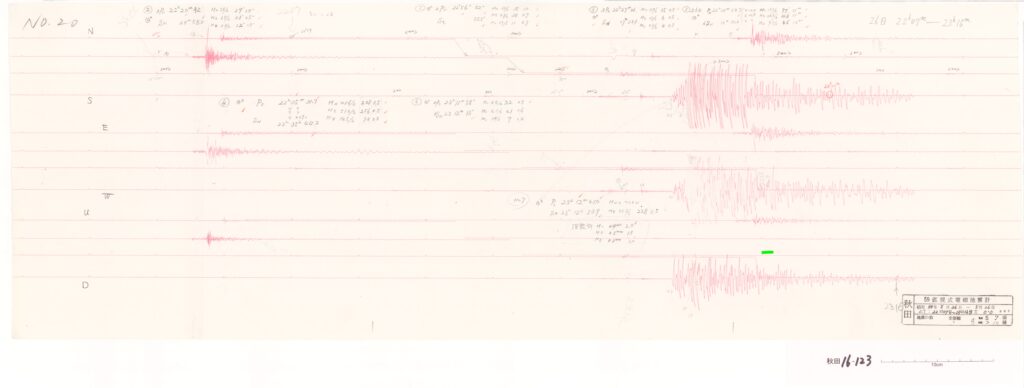
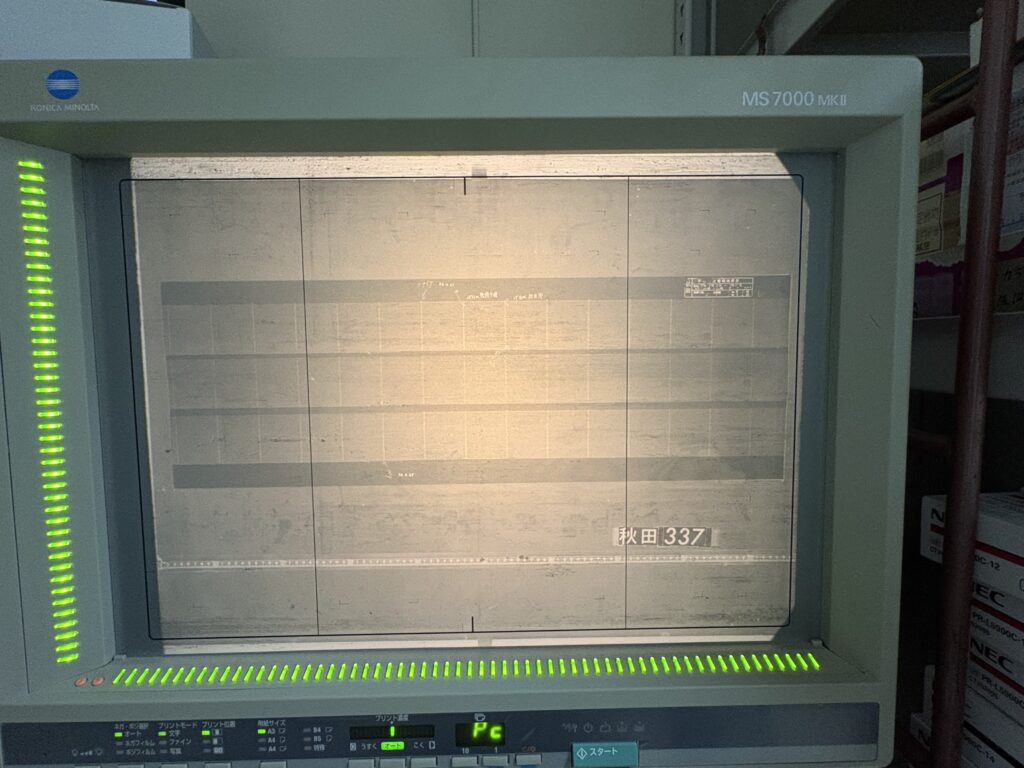
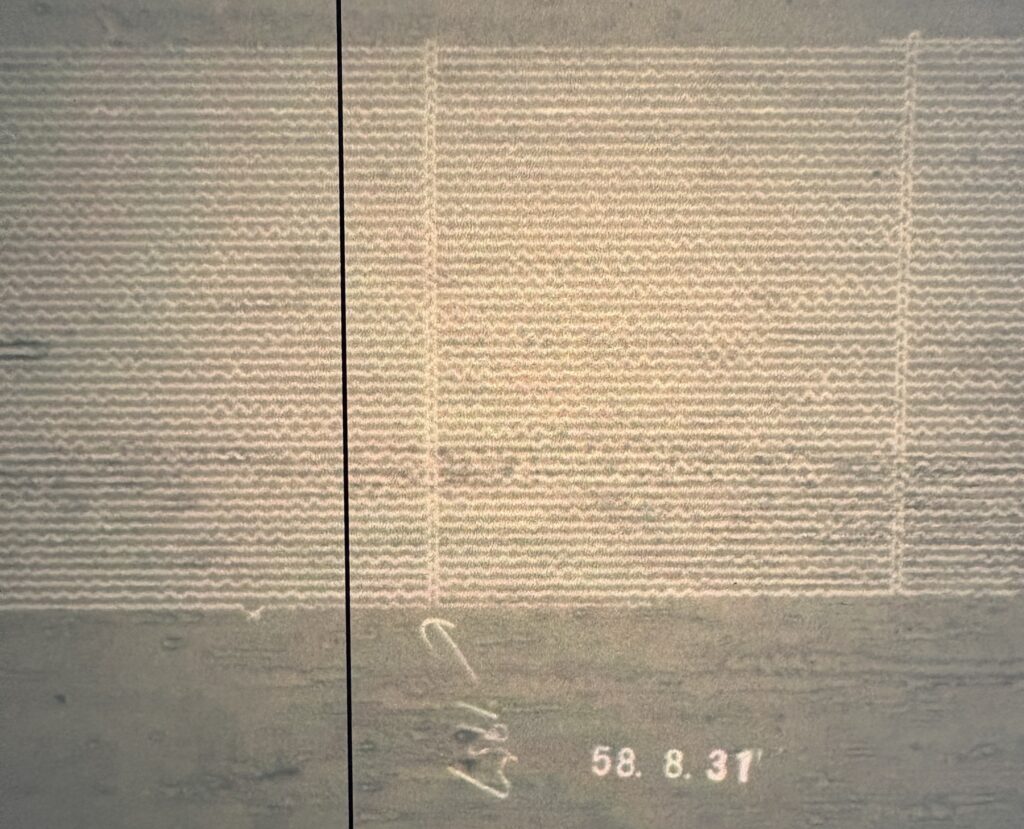
A poor quality photo of the Microfilm 12 hr recording of the data for the preceding 12 hr period prior to KAL007 impact is shown below. i.e. data below is midday Aug 31-midnight 31, 1983 Japan time, just a few hrs before KAL007’s expected impact. The noise appears much larger than the more detailed seismogram shown in the earthquake example above but it appears to be smaller than the 1mm deflection timing mark so a small event should still be detectable. It is also hoped that multiple recordings similar to the above were also recorded.
If it is shown that an event can be detected then the next question is what can be done with this information. The answer comes down to whether the event appears on one, two or more observatories. We can consider each case below.
Case 1. The event can just be detected at Akita (closest point) but not at Yamagata or Amori (both approximately 200km from estimated impact) due to signal attenuation (or missing data).
We know the rough timing of the impact from radio messages being 19:00-19:20 UTC with a most probable window 19:10-19:15 so any event appearing in this window can plausibly be from KAL007. The accuracy of picking the event manually from a seismogram travelling at 1mm/s is expected to be +/- 1 sec. Knowing that the rough travel time is around 15seconds for a P wave travelling at 6.5km/S and travel time in water being around 1 second at 1.5Km/Sec in 1000+m water depth we can further refine the impact time down to a relatively small window of around +/- 6 seconds (assuming the range from Akita is already constrained by the debris drift and radio analysis). If we believe that KAL007 was planing to reach the waypoint Niigata at exactly 19:30 to rejoin its flight plan (Pilot Captain Chun was known as the human computer) we can determine the distance from Niigata within +/- 1.5km if the flight speed is assumed at 897Km/hr (Standard 747-200 cruise speed at 35,000ft)
It is unlikely that the event would be sufficient to generate both a P(compressional) and detectable S (Shear) wave. In the unlikely case that a shear wave arrival can be detected then the distance from Akita can also be estimated. D = (Ts-Tp) *(Vp * Vs) / (Vp -Vs). Where Ts is the shear wave arrival time, Tp is the compressional wave arrival. Vp = 5.5 – 6.5Km/s and Vs = 3.2–3.8 km/s. Roughly a shear wave would arrive approximately 15 seconds after the P wave. Should a S wave be detected the empire rule of thumb as per SwissAir would be to multiply the dT by 8 for an estimate of the distance. The azimuth from observatory cannot of course be determined .
Another potential method is to generate synthetic seismogram from an approximate position using a model then comparing this to the actual signal, then iterating the position to closely match the observed signal. Using Pyrocko https://pyrocko.org and generating a model using local Sea of Japan parameters including a sediment layer 1.5Km thick the following synthetic seismogram was generated. i.e. this is the synthetic seismogram from an event at surface 100km away from Akita. This particular model was limited to under 2Hz. Should only one seismic record be recovered more work will be done in this area.
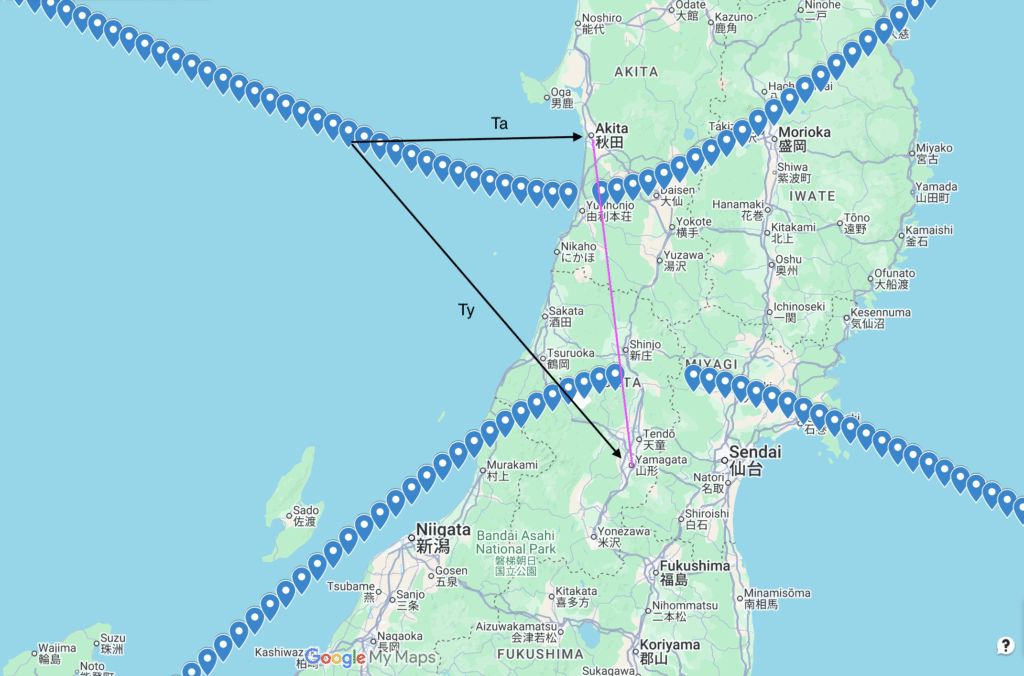
Case 2. The event is detected at two observatories. For example Akita and Yamagata. This now constrains the result to a perfect hyperbola with the Foci at Akita and Yamagata as per image below. The image below is for a 14second difference between event time at Akita and Yamagata. i.e. the hyperbola is defined such that Ty (time of arrival at Yamagata) minus Ta (time of arrival at Akita) is a constant 14 secs. Depending whether Akita or Yamagata arrival is first determines which curve. i..e Akita first then the event is on the top curve. Since we know KAL007 did not impact land then the search area is further refined just at locations on this curve offshore.
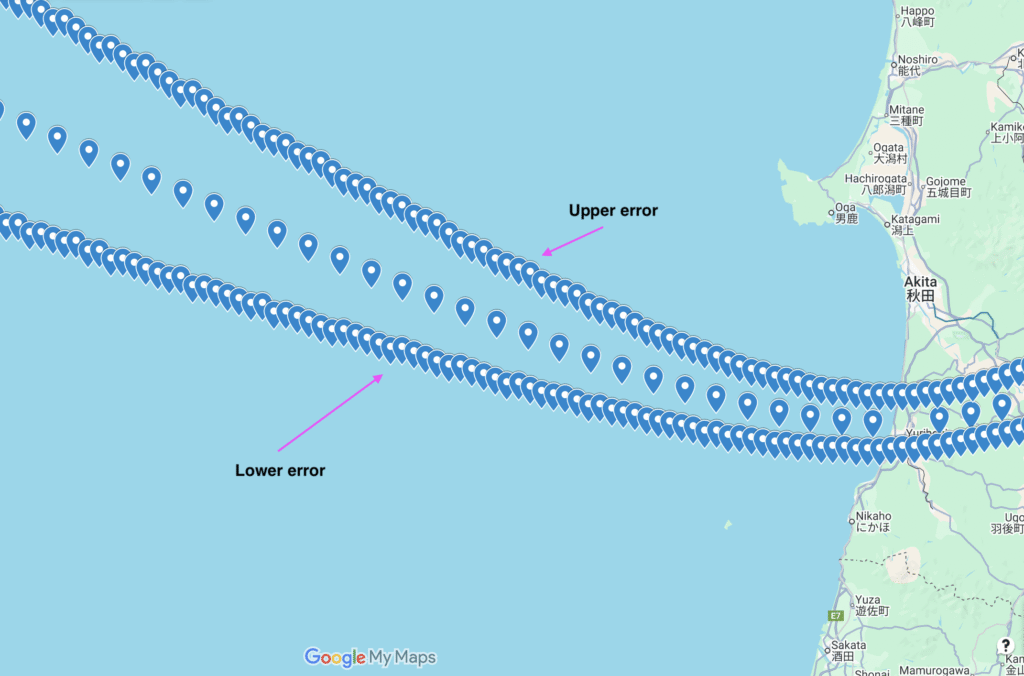
If we assume the error in picking the arrival from each station is +/- 1 second we can then produce error bars. For the case where Akita arrival is first and Yamagata is detected 14 seconds later this generates the following window of uncertainty. i.e. the window is roughly +/- 7.5Km in the north/south direction 50km from Akita increasing to +/- 15km at 100km from Akita.
The link below is an interactive map of the same errors where you can determine coordinates and measure errors. https://www.google.com/maps/d/edit?mid=1PRsYwtcZKGmjLT5V-WgmlwvR3OThFWg&usp=sharing
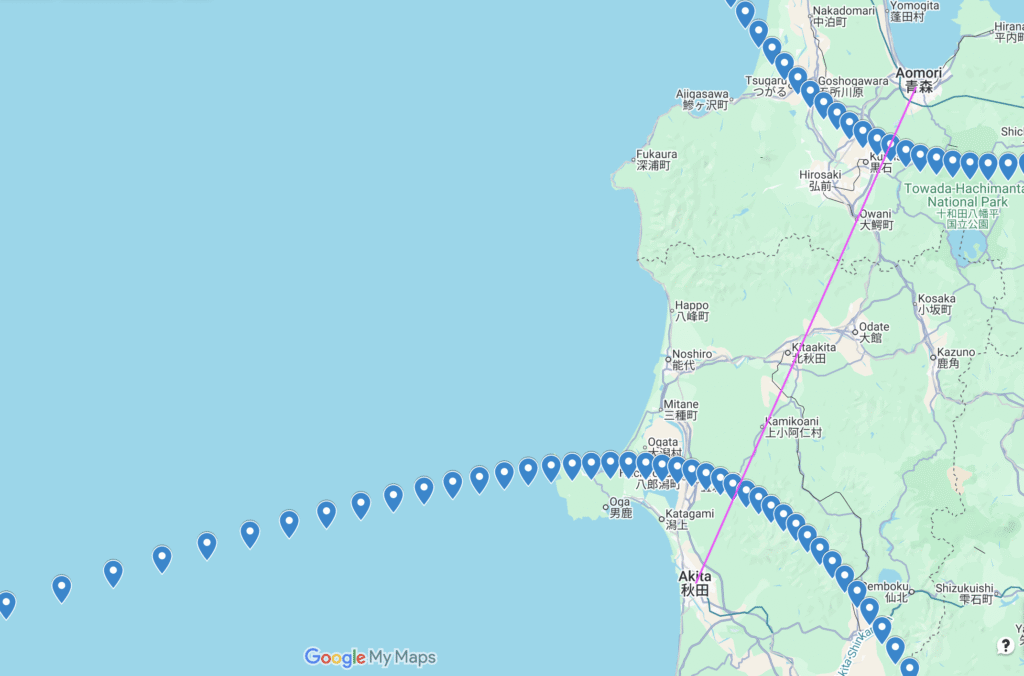
A similar hyperbola can be determined if arrivals appear at both Akita and Aomori observatories. Interactive link here https://www.google.com/maps/d/edit?mid=1jmCWFs-QD6vsflm2sc10_TDjC5WvBkY&usp=sharing
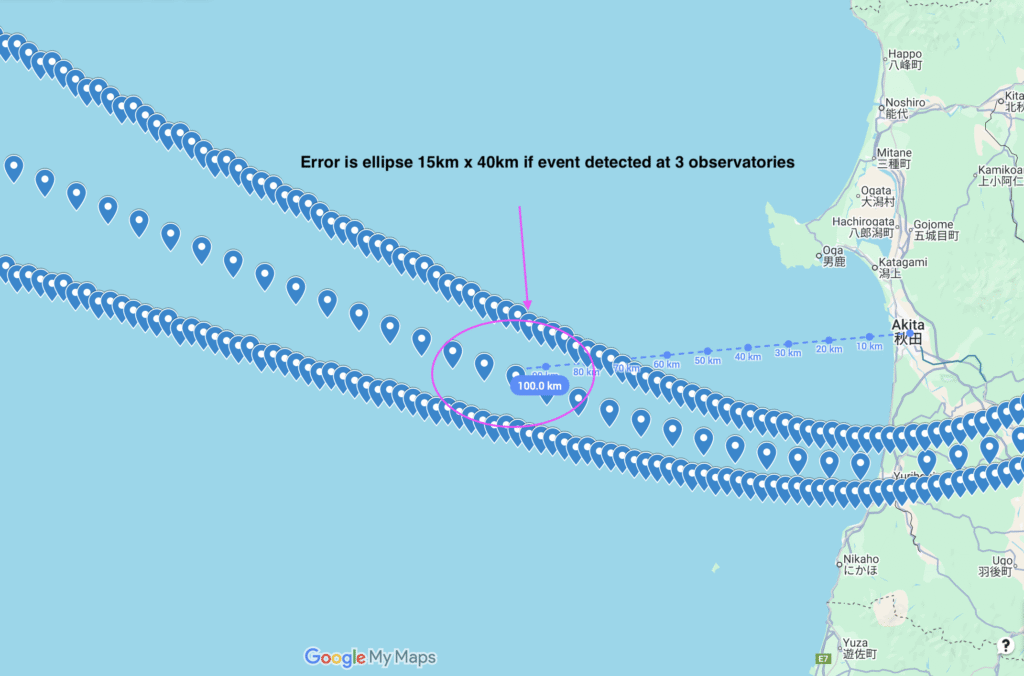
Case 3. The ideal case is where the event can be detected on 3 or more observatories. Akita, Aomori and Yamagata are the closest. Assuming the error in measurement at each station is +/- 1sec this constrains the area to an eclipse 15km in the N/S direction and 40km in the E/W direction. This is because the 3 stations are roughly N/S so there is less certainty in E/W
If the event was also detected at Sendai or other observatories then the impact uncertainty can be reduced further. i.e. with Sendai added to the mix the E/W uncertainty would be reduced to 25km and the N/S reduced to 8-15Km. This matches closely with uncertainties of real micro seismic events detected in the area with a 10x20Km Ellipse defining the uncertainty of most events.
Whilst the Japanese records are most likely in good condition the main challenge will be the strength of the signal relative to the background noise. Contrast this with the Sakhalin data. The data if it can be retrieved in readable format should show clearly any aircraft crashes that morning. This is because water depth in the region closely matches that of Swissair 111 and distances all within 200Km so seismic signals should be of approximately the same magnitude.
We know for sure at least one aircraft that was not KAL007 came down somewhere in the vicinity of Moneron Island. However there are large irregularities in the timing of this event. i.e. Russian 18:24 UTC, Japanese 18:28 and US 18:38. According to Michel Brun these irregularities can be explained by multiple aircraft crashes. He believes as many as 13 aircraft crashed that night in the air battle of Sakhalin. This includes what he believes is 3 crashes on land. Retrieval of just one seismogram will reveal whether Brun’s theory is plausible or not. If only one event is shown it will clarify the timing. Ideally records are retrieved from two or more stations.
A similar exercise can be done for the Sakhalin stations.
According to Brun these are the approximate locations of aircraft crashes. This was based on observations of various countries search vessels, Japanese fishermen retrieving wreckage in nets (wreck 9), Russians showing pictures of a hole in the ground and the DFDR as handed over by Yeltsin.
Wreck 1 141.68015,46.43726, Wreck 2 141.33915,46.55035, Wreck 3 141.30643,47.08456, Wreck 4 141.32247,46.61430, Wreck 5 141.34074,46.39769, Wreck 6 141.44774,46.55428, Wreck 7 140.97015,46.56994, Wreck 8 – ?, Wreck 9 (SR71) 45°08′ N, 144°00′ E , Wreck 10 140.28899,46.10017, Wreck 11 46.583989, 141.842316 – Hole in the ground, Wreck 12 47.16, 142.53 – Central Sakhalin (DFDR stops here), Wreck 13 -?
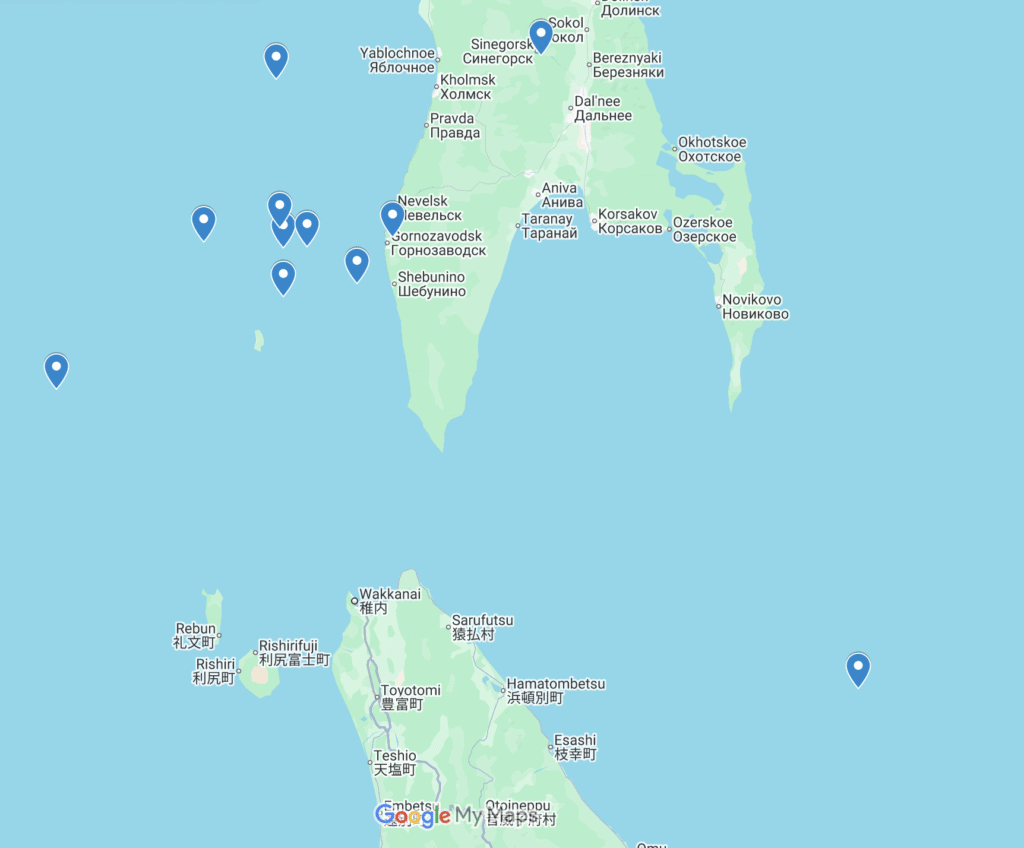
The majority are situated in an area north of Moneron island. YSS (Yuzhno) observatory is located at Latitude: 46.9587°NLongitude: 142.7604°E. KRS (Korsakov) at Latitude: 46.634°NLongitude: 142.777°E, Dolinsk (OSM?) Latitude: 47.317°NLongitude: 142.800°E, OJD (Ozhidayevo) at Latitude: 46.55°NLongitude: 141.85°E and UGL (Uglegorsk) Latitude: 49.083°NLongitude: 142.033°E Latitude: 49.22°NLongitude: 143.10°E. An interactive map showing Brun’s wreck locations and seismic stations on Sakhalin https://www.google.com/maps/d/edit?mid=1p3EUho2Y1C6uFJL1VMI9NyEmLK3KaPs&usp=sharing
The “official” ICAO crash location of KAL007 is 46.558889N 141.328056E. This is 117Km from YSS. The water depth from Openseamap is between 100-250m. Based on a similar impact to Swiss air 111 in this location the seismic signal as recorded at Yuzhno should be in the order of 3mm deflection. (+/-1.5mm)
The observatory at OJD (Ozhidayevo) is 40km from the official impact site. Therefore the signal is expected to be almost identical to SwissAir 111 with 9.5mm deflection. +/- 4.75mm